
Here’s what the average household looks like in South Africa
In 2021, South Africa had a population of approximately 60.5 million people. Although some people resided in institutions such as hospitals and old age homes, the country had an estimated 18 million households, with an average household size of 3.34 persons.
A quick glance at the General Household Survey, 2021 (GHS) released by Statistics South Africa, shows that approximately one-quarter (23.3%) of households were single-person households, while 13.9% had six members or more. In KwaZulu-Natal, a fifth of all households contained more than five members.
More than two-fifths (42.1%) of all households were headed by women, and female-headed households were most common in rural areas (47.7%).
The General Household Survey has tracked the progress of development across several broad areas since 2002. Households are the building blocks of society and their well-being reflects on the welfare of our society. Let’s take a look at some of the interesting facts about how households in SA function and the services they get.
Household composition
Nuclear households (households that contain spouses/partners with or without biological children) comprised 41.5% of all households. Slightly more than one-third (33.6%) of households were extended, meaning that they contained biological parents and their children as well as in-laws, grandparents, aunts, uncles, and cousins. These were most common in rural areas.
The largest percentage of households contained two generations (42.1%), while 13.6% contained three generations, and 4.6% could be considered skip-generation households where grandparents lived with their grandchildren. In addition to the 23.3% of single person households, 13.8% of households were comprised of partners co-residing in single-generation households.
Nationally, more than half (52.9%) of all households contain at least one child, and 27.1% contained at least one child below the age of five years. More than a fifth (22.7%) of households contained at least one elderly person.

Housing
More than four-fifths (83.6%) of all households lived in formal dwellings; 11.7% lived in informal, and 4.2% lived in traditional, dwellings. Almost 70% of households owned the dwelling they lived in while 18.7% rented it and 11.6% indicated that they lived in their dwellings without charge.
Water
Although 88.7% of all households used tap water in their dwellings, their yards or from their neighbour’s or communal taps, only 45.2% had water inside their dwellings. An evaluation by income quintile shows that the percentage of households with access to piped water in the dwelling increases with higher income quintiles, while reliance on other sources, including using taps in the yard, decreases.
Sanitation
Household access to sanitation increased from 61.7% in 2002 to 84.1% by 2021. The largest increases during this period were noted in Eastern Cape (58.3 percentage points) and Limpopo (31.6 percentage points).
Nationally, only 64.8% of households used flush toilets, while 19.3% used pit toilets with ventilation pipes and 13.4% used pit toilets without ventilation pipes.
Pit toilets with ventilations pipes were most common in Eastern Cape (43.9%) while pit toilets without ventilation pipes were most common in Limpopo (41.1%). Approximately 94% of households in income quintile 5 used a flush toilet compared to 43.3% of quintile 1 households.
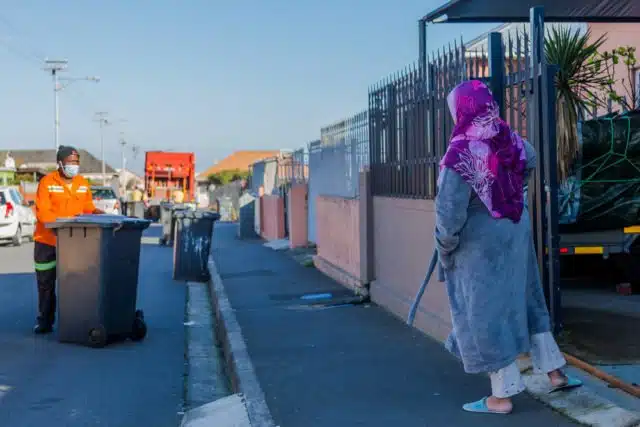
Refuse removal
Household refuse was removed at least once per week or less often for 62,9% of all households, while more than one-third (35,1%) of households had to rely on communal or their own refuse dumps. Refuse removal was most common in urban areas (85,4%) while 79,4% of rural households used their own refuse dumps.
Energy
Household access to mains electricity increased from 76.7% in 2002 to 89.3% in 2021. The highest increase was noted in Eastern Cape, where access to mains electricity increased by 37.2 percentage points from 55.3% to 92.5% during this time.
The GHS found that 79.6% of households used pre-paid electricity and 12.5% used conventional in-house meters. Nationally, 77.7% of households used electricity for cooking. The percentage was, however, much higher in quintile 5 (85.4%) than in quintile 1 (70.6%) households.
A much higher percentage of quintile 5 households used gas for cooking while quintile 1 households were more likely to use paraffin and wood for cooking.
An income quintile is a method to measure the average (per capita monthly) household income of residents, ranking them from poorest to wealthiest, and then grouping them into five income quintiles (1 being poorest and 5 being wealthiest), each quintile containing approximately 20% of households.

Although all households (97.3%) had at least one mobile phone, only 7% owned a landline.
More than three-quarters (77.5%) of households had access to the internet in one way or the other, but only 10,4% of households could access the internet at home using fibre or ADSL. Mobile devices made access relatively common (69.4%) and more equitable as it provided access to almost three-fifths (59.2%) of rural households, compared to 73.7% of urban households.
Transport
One-third (33.6%) of all households contained at least one member who used a minibus taxi/sedan taxi or bakkie taxi during the week preceding the survey. By comparison, only 3.7% of households used a bus, while less than one percent (0.2%) used trains.
Less than one-third (29.8%) of South African households owned at least one vehicle in working condition. Ownership was, however, associated with socio-economic status. While 77.9% of quintile 5 households owned a vehicle, the same was true for only 6% of quintile 1 households.
Of the households that owned vehicles, the majority (59.1%) owned only one vehicle, while only 9.9% of households owned three or more vehicles.
Sources of income
Income from wages and salaries (59.4%) and from social grants (51%) were the most common source of income for households, followed by remittances (15.5%) and income from a business (15%). Nationally, 52.4% of households listed salaries and wages as their main source of income compared to social grants (24.4%).
However, in Eastern Cape, the percentage of households that received grants as a main source of income exceeded those that received salaries and wages (42% compared to 37.3%).

Access to social grants has increased between 2003 and 2021, growing from 12.8% to 35.7% for persons, and 30.8% to 50.6% for households.
Salaries and wages were more common as main sources of income in quintile 5 (77.3%) than in quintile 1 (14.8%), while the inverse was true for social grants and social remittances. Only 0.2% of quintile 1 households received pensions compared to 8.4% of quintile 5 households.
Assets
Assets, whether they are owned by individuals or by households, may provide a range of direct and indirect benefits, including status and security, to their owners. Household assets influence the extent to which households can diversify their livelihoods. Asset poverty is an economic and social condition that is more persistent and prevalent than income poverty.
Although 12.8% of households contracted a security company, the figure was 20,9% in metropolitan areas and 44.6% for households in quintile 5. By comparison, only 1.2% of households in quintile 1 used security.
About one-third (31.9%) of households had a warm water geyser. Access, however, differed across income quintiles, ranging from 8,5% for households in quintile 1 to 78.9% for households in quintile 5.
Less than a third of households (27.3%) owned computers. Ownership ranged from 5.8% for households in quintile 1 to 32.3% for those in quintile 4, and 72.7% for households in quintile 5.
Read: The cheapest and most expensive credit accounts in South Africa
